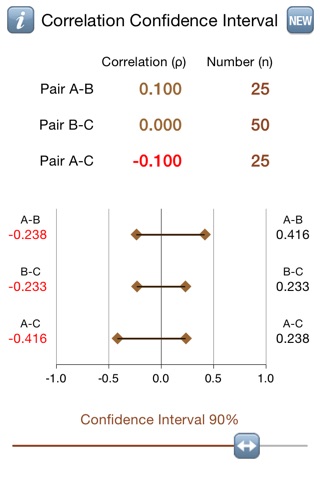
Correlation Confidence Intvls
Correlation is a quantitative tool commonly used by researchers to separate data sets into independent subgroups. Hypothesis testing determines whether or not the subgroups are numerically distinct. The degree to which the researcher can say the subgroups are distinct depends upon the overlap between the subgroups measured by the confidence interval estimates. The confidence interval estimates reflect the reality that there are errors in all quantitative estimates.
If correlation estimates were normally distributed, estimates of confidence intervals would be straightforward. However, correlation estimates are bound within the range of –1.0 to +1.0. The common technique devised by R.A. Fisher involves a nonlinear transformation of correlation functions into random variables that are approximately normal. The technique is known as Fishers z-transformation and is formally expressed as ρ = tanh(z), where tanh( ) is the hyperbolic tangent function.
More simply, the transformed standard error, z, is defined as z = (1/2) ln[ (1 + ρ) / (1 – ρ) ]. The variance is a function of the number of paired samples in the sets being correlated and is defined as var(z) = 1 / (n – 8/3).
Thus, for example, the 95% confidence interval around a correlation estimate would be from (z – 1.96 σ) to (z + 1.96 σ) where σ = sqrt( 1/ (n – 8/3) ).
The iPad version allows you to add, retrieve, reorder, or delete data sets. Also, you may email, send via texting, and print data and results.
